
December 28, 2019 ( last updated : July 01, 2017 )
DataScience
Data Analysis
https://github.com/SEUNGJO/PythonDataScience
Extracting essential data from a dataset and displaying it is a necessary part of data science; therefore individuals can make correct decisions based on the data. In this assignment, you will extract some essential economic indicators from some data, you will then display these economic indicators in a Dashboard. Gross domestic product (GDP) is a measure of the market value of all the final goods and services produced in a period. GDP is an indicator of how well the economy is doing. A drop in GDP indicates the economy is producing less; similarly an increase in GDP suggests the economy is performing better. In this lab, you will examine how changes in GDP impact the unemployment rate.
We will import the following libraries.
import pandas as pd
from bokeh.plotting import figure, output_file, show,output_notebook
output_notebook()
def make_dashboard(x, gdp_change, unemployment, title, file_name):
output_file(file_name)
p = figure(title=title, x_axis_label='year', y_axis_label='%')
p.line(x.squeeze(), gdp_change.squeeze(), color="firebrick", line_width=4, legend="% GDP change")
p.line(x.squeeze(), unemployment.squeeze(), line_width=4, legend="% unemployed")
show(p)links={'GDP':'https://s3-api.us-geo.objectstorage.softlayer.net/cf-courses-data/CognitiveClass/PY0101EN/projects/coursera_project/clean_gdp.csv',\
'unemployment':'https://s3-api.us-geo.objectstorage.softlayer.net/cf-courses-data/CognitiveClass/PY0101EN/projects/coursera_project/clean_unemployment.csv'}Use the dictionary links and the function pd.read_csv to create a Pandas dataframes that contains the GDP data.
import pandas as pd
links={'GDP':'https://s3-api.us-geo.objectstorage.softlayer.net/cf-courses-data/CognitiveClass/PY0101EN/projects/coursera_project/clean_gdp.csv',\
       'unemployment':'https://s3-api.us-geo.objectstorage.softlayer.net/cf-courses-data/CognitiveClass/PY0101EN/projects/coursera_project/clean_unemployment.csv'}
df = pd.read_csv(links["GDP"])import pandas as pd
links={'GDP':'https://s3-api.us-geo.objectstorage.softlayer.net/cf-courses-data/CognitiveClass/PY0101EN/projects/coursera_project/clean_gdp.csv',\
'unemployment':'https://s3-api.us-geo.objectstorage.softlayer.net/cf-courses-data/CognitiveClass/PY0101EN/projects/coursera_project/clean_unemployment.csv'}
gdp_df = pd.read_csv(links["GDP"])
gdp_df.head()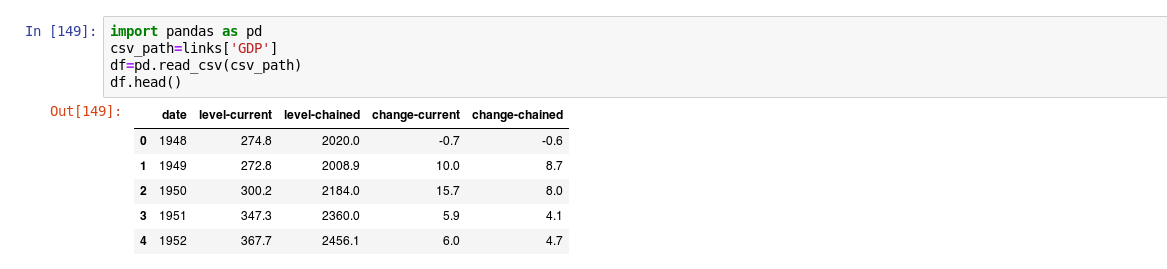
import pandas as pd
links={'GDP':'https://s3-api.us-geo.objectstorage.softlayer.net/cf-courses-data/CognitiveClass/PY0101EN/projects/coursera_project/clean_gdp.csv',\
'unemployment':'https://s3-api.us-geo.objectstorage.softlayer.net/cf-courses-data/CognitiveClass/PY0101EN/projects/coursera_project/clean_unemployment.csv'}
df = pd.read_csv(links["unemployment"])
df["unemployment"] >= 0.085
df1=df[df["unemployment"] >= 0.085]
df1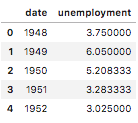 0 True
make_dashboard("dashboard")
x= df['date']
gdp_change = # Create your dataframe with column change-current
make_dashboard(gdp_change)
gdp_change=df['change-current']unemployment= df['unemployment']
make_dashboard(new_dashboard)
new_dashboard = "title"
file_name = "index.html"Originally published December 28, 2019
Latest update July 01, 2017
Related posts :